


In the last article, I went through how to implement a state machine in IAR Visual State. This article, as I mentioned before, covers how to use Verificator and how to verify the design with the simulator.
Verificator is located here: Project>Verify Systems or press F10

After clicking "Verify", green checks will pop up. If there are unused elements, this tool can notify the user here. Let me add one state and re-run Verifiactor.

As you can see above, "Unused states" report a warning.
To run the simulator, Project>Simulate Project or press F8.

To start debug, double-click SE_RESET().

After the initial transition, it shows the current state is Red shown above. Also, '>' indicates that Button1() is available in the Red state. After double-clicking Button1(), the current state is changing to Yellow.

At the Yellow state, either Button2() or Button1() can move to another state. Without remembering the state machine, the debugging process is not that easy. So, IAR Visual State creates another option to animate this process better way.
In IAR Visual State Simulator, run Graphical Animation option in Debug tab.
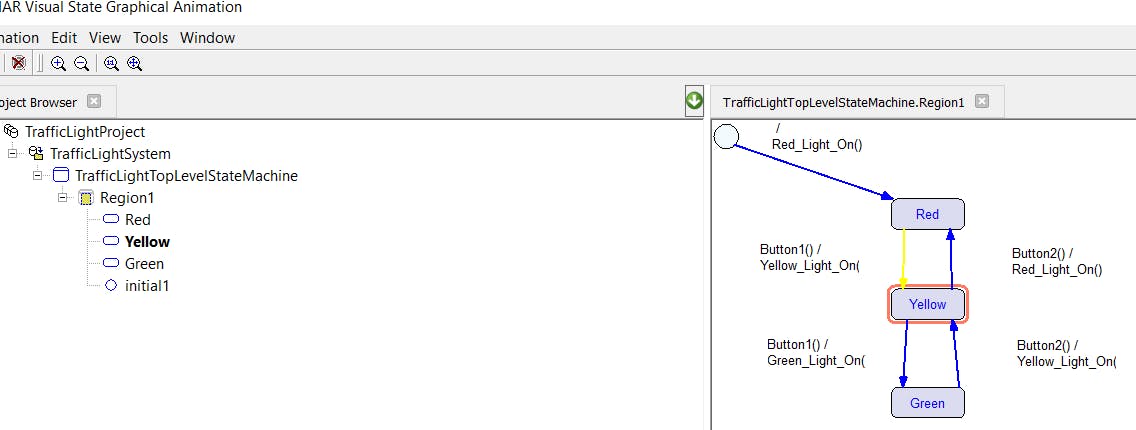
The yellow arrow is blinking from the Red state to the Yellow state. It is much easier to notice what is happening. The Yellow state is also surrounded by the red line to indicate its current state. The user can trigger the desired event to observe transition and validate all data paths with this tool.
How to verify design is covered in this article by using Verificator and Simulator. The next article will cover how to generate the code.